DATA VISUALISATIONS
Front-end Development
School project • HTML/CSS/JS • Leaflet.JS/D3.JS
Front-end Development
School project • HTML/CSS/JS • Leaflet.JS/D3.JS
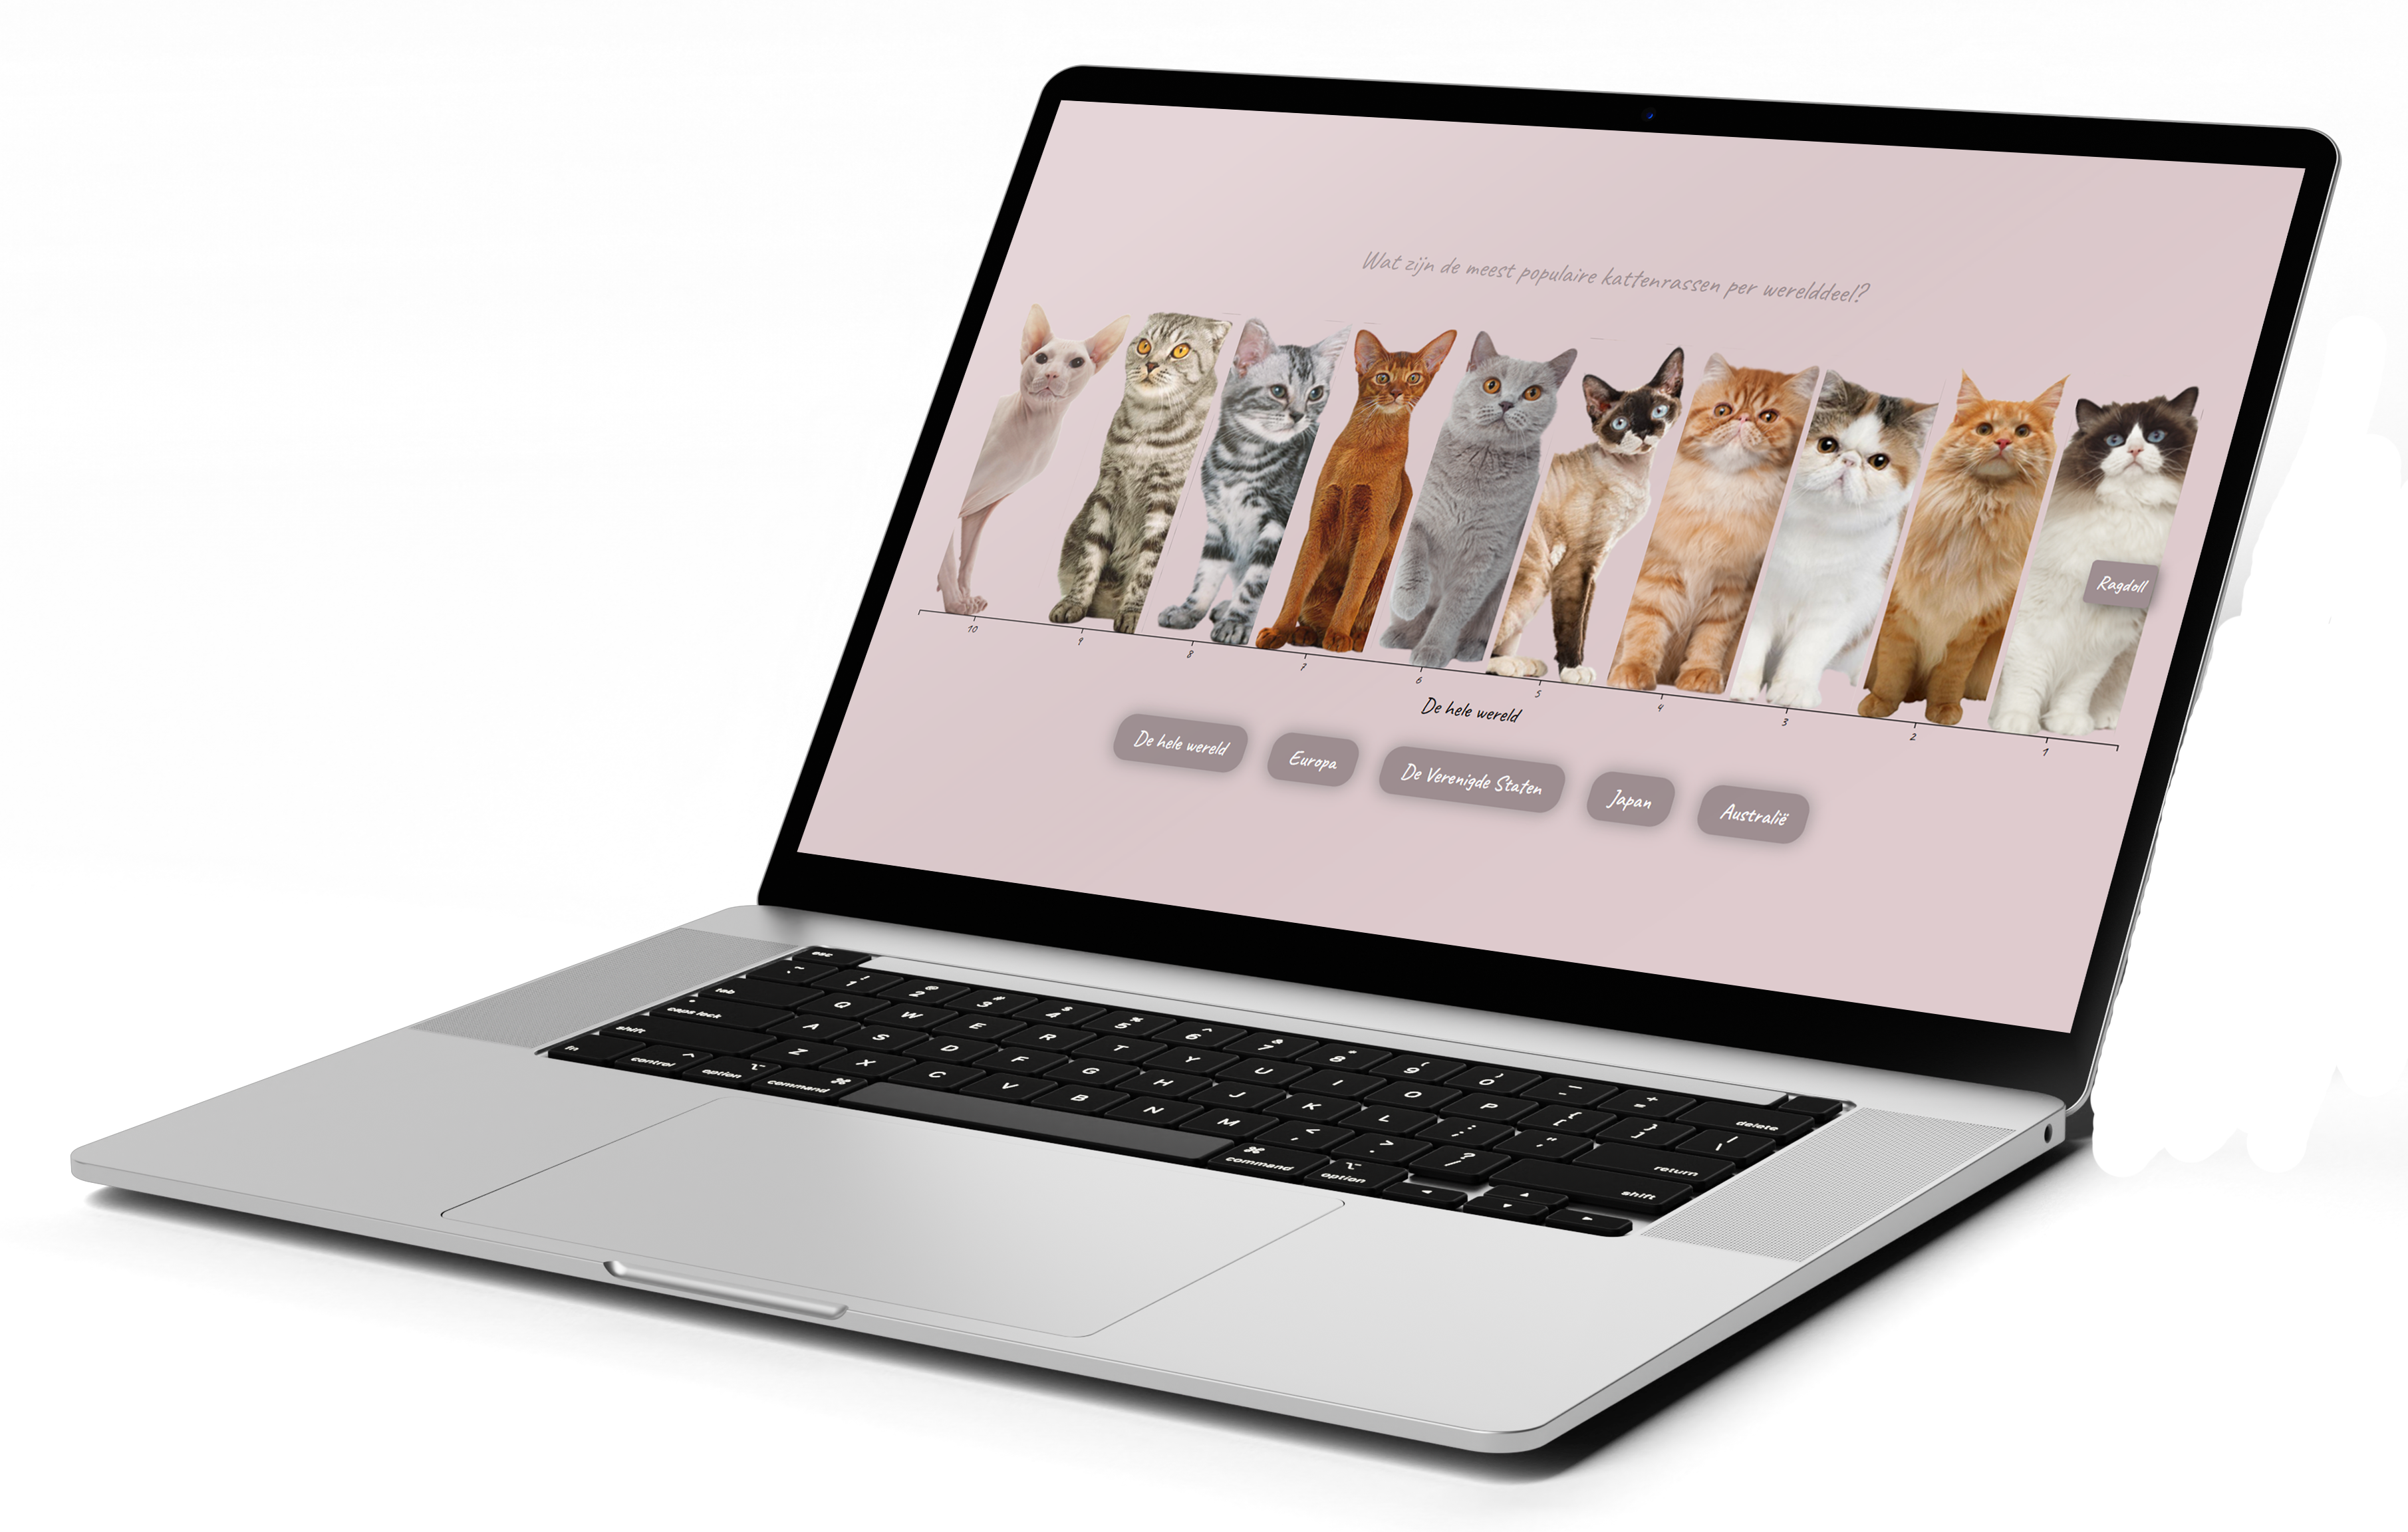
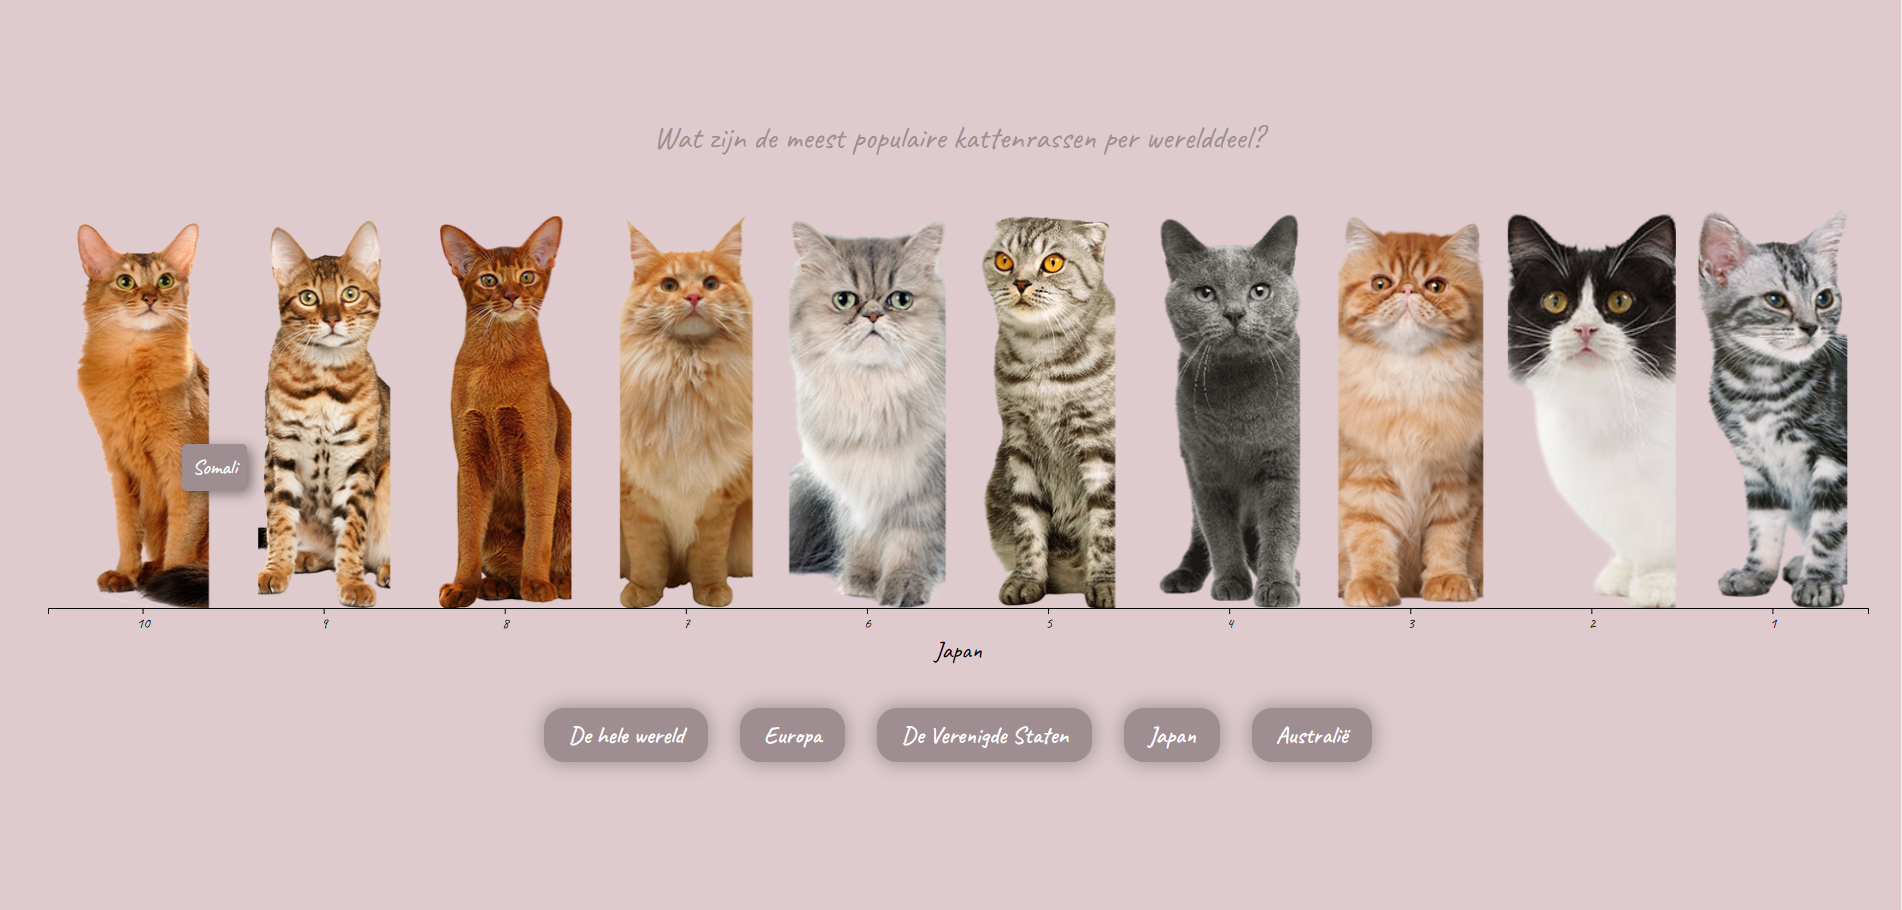
During this assignment, we had a lot of freedom, as long as we made a dashboard/an experience that conveys knowledge by parsing data and visualizing it. I decided to make an experience containing information about cats. The centerpiece is a filterable bar chart that highlights the popularity of cat breeds in different parts of the world, complemented by an interactive map showcasing the origins of cat breeds using Leaflet.js.
Check it out!* works best on laptop/desktop screens.
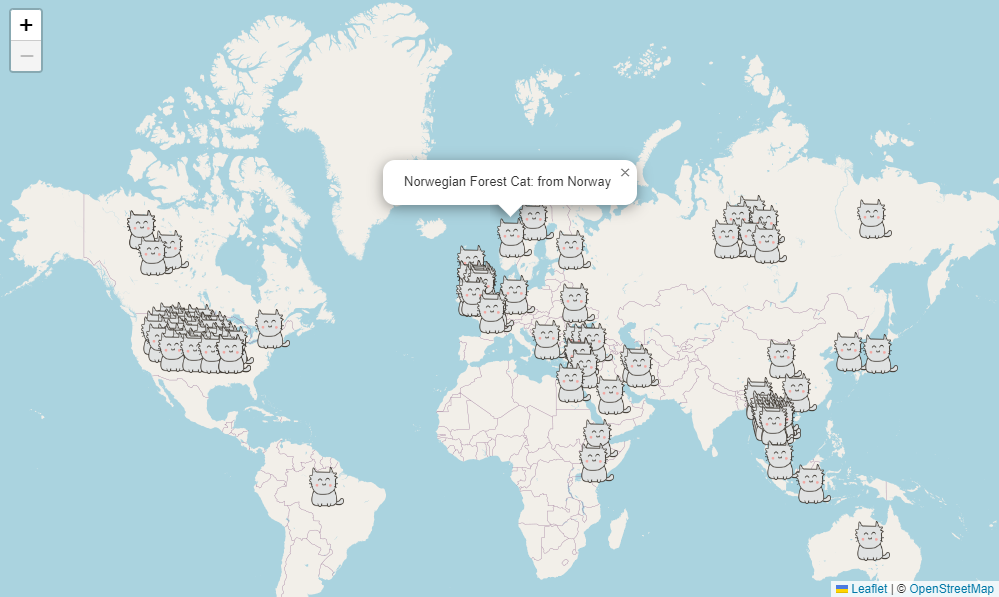
Using Leaflet.js, it’s relatively easy to make an interactive map with a custom location marker and informative popups triggered when clicked. The information in these popups, alongside their coordinates, is stored in a JSON file. The data is loaded into the map with JavaScript, where a looping mechanism generates location markers containing the right information.
The bar chart was made with D3, which, in my opinion, is a pretty difficult library to use. Once the bar chart itself was done, there were some additional tasks, such as creating custom SVG patterns for each cat so I could make them into the bars, and also making the filter function. The filter function was made possible with some assistance from my teacher. By giving each cat its own ‘category’ in the JSON file, I could filter them based on their category using buttons.

Applying the knowledge I gained during this project, I made a web page all about cats, with interactive data visualizations and interesting information about cats.
If you want to check out the code or the full documentation:
Github repo